
ECG Interpreter
An electrocardiogram (ECG) is a simple, non-invasive test that records the electrical activity of your heart. It's a vital tool used by healthcare professionals to diagnose a variety of heart conditions. While interpreting an ECG might seem complex, understanding the basics can empower you to participate in your healthcare journey.
The Basics Signal Nomenclatures of an ECG


NORMAL ECG INTERVALS
Electrocardiography (ECG) is one of the most vital and readily used screening tools in clinical medicine. It is inexpensive and easily obtained in both the inpatient and outpatient setting. The ECG is used to diagnose numerous cardiac conditions, including prior infarction and active cardiac ischemia, as well as conduction abnormalities such as atrial fibrillation and life-threatening tachycardias. The information provided by ECGs also is used in determining which type of implantable cardiac defibrillator should be used for the management of advanced heart failure. Numerous noncardiac conditions, including electrolyte abnormalities and medication side effects, also are detectable on ECG owing to their distinct effect on conduction patterns.

A well-planned approach to 12-lead ECG interpretation will prevent the interpreter from missing crucial information. Key aspects in the interpretation of the 12-lead ECG include the heart rate, the heart rhythm (both atrial and ventricular), the electrical axis (both the P-wave axis and the QRS axis), and knowledge of the normal intervals. ECG paper commonly moves at 25 mm/second; thus, each small box (1 mm) is equivalent to 0.04 seconds (40 milliseconds), and each large box (5 mm) is equivalent to 0.2 seconds (200 milliseconds). At the beginning of an ECG, make note of the standardization square, normally 10 mm high by 5 mm wide. This will alert you to the correct paper speed and standard amplification of P, QRS, and T-wave complexes.

Normal ECG values for waves and intervals are as follows:
-
RR interval: 0.6-1.2 seconds
-
P wave: 80 milliseconds
-
PR interval: 120-200 milliseconds
-
PR segment: 50-120 milliseconds
-
QRS complex: 80-100 milliseconds
-
ST segment: 80-120 milliseconds
-
T wave: 160 milliseconds
-
QT interval: 420 milliseconds or less if heart rate is 60 beats per minute (bpm)
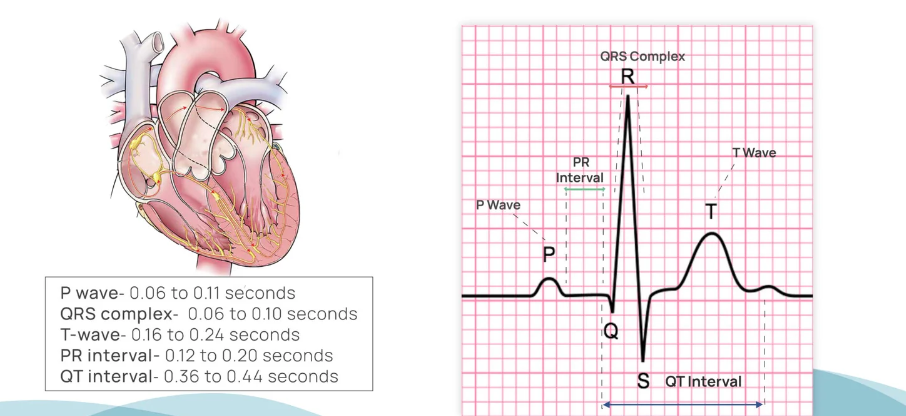
Fig1- Sunfox Technologies

Understanding Abnormal ECG Signals
An abnormal ECG result could mean anything from an abnormal heart rate, irregular rhythm, abnormal waveforms or abnormal intervals

1. Abnormal heart rate: A heart rate that is faster or slower than what is considered normal could be a sign of atrial fibrillation
2. Abnormal heart rhythm: An irregular heart rhythm refers to an ECG reading with long pauses or extra beats.
3. Abnormal waveform: Abnormalities in the waveforms of an ECG reading could mean that the electrical signals in the heart are not being transmitted or conducted properly.
4. Abnormal intervals: A prolonged PR interval can indicate a problem with the electrical conduction system of the heart (delayed conduction of the SA node), while a prolonged QT can indicate a problem with the lower chambers of the heart(ventricles).

Common ECG Abnormalities
INTERPRETATION OF VARIOUS ECG SIGNALS IMPLIFYING UNDERLYING HEART CONDITIONS

A second-degree heart block is a type of arrhythmia where not all electrical impulses from the atria reach the ventricles. This leads to an irregular heartbeat.
In the above Figure (a) Mobitz Type I shows progressive PR interval lengthening before a dropped beat. Mobitz Type II has a consistent PR interval followed by sudden dropped beats.

Fibrillation is a chaotic, disorganized heart rhythm. Atrial fibrillation (AFib) causes rapid, irregular atrial contractions. Ventricular fibrillation (V-Fib) is life-threatening, leading to ineffective pumping and potential cardiac arrest.
In the above Figure(b) ECG shows irregular baseline with absent P waves in AFib and chaotic waves in V-Fib.

Tachycardia is a rapid heart rate, often over 100 beats per minute.
In the above figure (c) ECG shows narrow or wide QRS complexes depending on the origin of the rapid rhythm. Sinus tachycardia has normal P waves, while other tachycardias may lack distinct P waves or have abnormal QRS morphology.

Ventricular fibrillation (V-Fib) is a life-threatening arrhythmia where the heart's ventricles quiver chaotically.
IN the above Figure(d) ECG shows irregular, chaotic waves with no discernible P waves or QRS complexes.
An Immediate defibrillation is crucial to restore a normal heart rhythm.

Third-degree heart block is a complete block of electrical signals between the atria and ventricles.
In the above Figure(d) ECG shows independent atrial and ventricular activity.
P waves and QRS complexes are dissociated, meaning they occur at their own rates.
This severe arrhythmia often requires a pacemaker.
Conclusion
Electrocardiography (ECG) remains an indispensable tool in the diagnosis and management of various heart conditions. By decoding the intricate patterns of electrical activity captured in ECG signals, healthcare professionals can gain valuable insights into the health of the heart.
This portfolio has delved into the interpretation of different ECG signals, including those associated with normal sinus rhythm, arrhythmias, conduction abnormalities, and myocardial ischemia. Understanding the underlying mechanisms of cardiac arrhythmias, such as atrial fibrillation, ventricular tachycardia, and heart block, is crucial for timely intervention and effective treatment.
By recognizing the characteristic ECG features of these conditions, clinicians can make informed decisions about appropriate therapeutic strategies, including medications, catheter ablation, or implantable devices.In addition to traditional ECG analysis, advancements in technology have enabled the use of advanced signal processing techniques, such as machine learning and artificial intelligence, to enhance the accuracy and efficiency of ECG interpretation.
These automated systems can assist in the detection of subtle abnormalities that may be missed by human analysts, leading to earlier diagnosis and improved patient outcomes.As technology continues to evolve, it is anticipated that ECG will play an even more significant role in preventive cardiology.
By leveraging wearable devices and remote monitoring systems, individuals can track their heart health and identify potential issues early on. This proactive approach can help reduce the risk of serious cardiac events and improve overall cardiovascular health.In conclusion, the ability to decode ECG signals is a fundamental skill for healthcare professionals.
By mastering the art of ECG interpretation, clinicians can provide optimal care for patients with a wide range of heart conditions.

ECG interpretation requires clinical correlation and experience. Always consider the patient's symptoms and medical history.